
There are affiliate links on this page. Read our disclosure policy to learn more.
 According
to the
University of Maine, An ice core is
According
to the
University of Maine, An ice core is
a cylinder-shaped sample of ice drilled from a glacier. Ice core records provide the most direct and detailed way to investigate past climate and atmospheric conditions. Snowfall that collects on glaciers each year captures atmospheric concentrations of dust, sea-salts, ash, gas bubbles and human pollutants. Analysis of the physical and chemical properties of an ice core can reveal past variations in climate ranging from seasons to hundreds of thousands of years. Ice core records can be used to reconstruct temperature, atmospheric circulation strength, precipitation, ocean volume, atmospheric dust, volcanic eruptions, solar variability, marine biological productivity, sea ice and desert extent, and forest fires..
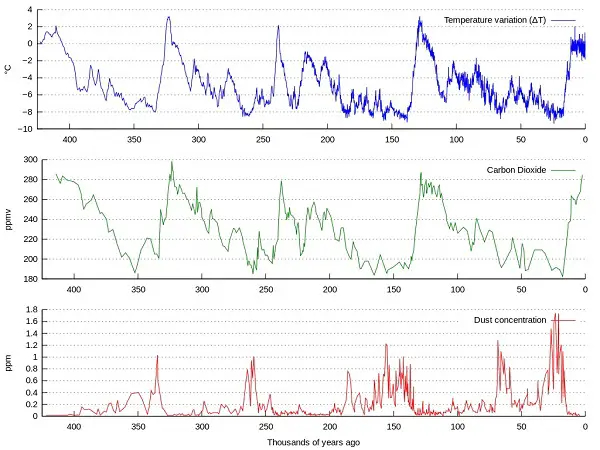
As we look at a grpah of the data from ice core samples, at left, we can see trends.
According to CDIAC (These records are maintained by the World Data Center for Paleoclimatology, National Oceanic and Atmospheric Administration (NOAA),)
Over the last 800,000 years atmospheric CO2 levels as indicated by the ice-core data have fluctuated between 170 and 300 parts per million by volume (ppmv), corresponding with conditions of glacial and interglacial periods. The Vostok core indicates very similar trends. Prior to about 450,000 years before present time (BP) atmospheric CO2 levels were always at or below 260 ppmv and reached lowest values, approaching 170 ppmv, between 660,000 and 670,000 years ago. The highest pre-industrial value recorded in 800,000 years of ice-core record was 298.6 ppmv, in the Vostok core, around 330,000 years ago. Atmospheric CO2 levels have increased markedly in industrial times; measurements in year 2010 at Cape Grim Tasmania and the South Pole both indicated values of 386 ppmv, and are currently increasing at about 2 ppmv/year.
What does this mean?
It tells us that over bvvery large periods of time, atmospheric CO2 levels are cycling, and are currentlyincreasing. It does not tell us why.
The government of Scotland says:
"Ice core data shows a complex picture, but there are some very obvious features.
References:
-->