
There are affiliate links on this page. Read our disclosure policy to learn more.
 So, you've heard the
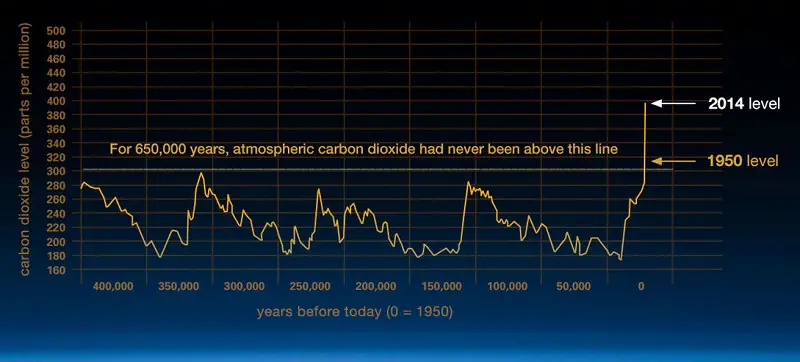
atmospheric levels of carbon dioxide are rising; CO2 is one of thegreenhouse
gases. According to NASA, this graph, based on the comparison of atmospheric
samples contained in ice cores and more recent direct measurements, provides
evidence that atmospheric CO2 has increased since the Industrial Revolution.
(Credit: Vostok ice core data/J.R. Petit et al.; NOAA Mauna Loa CO2 record.)
So, you've heard the
atmospheric levels of carbon dioxide are rising; CO2 is one of thegreenhouse
gases. According to NASA, this graph, based on the comparison of atmospheric
samples contained in ice cores and more recent direct measurements, provides
evidence that atmospheric CO2 has increased since the Industrial Revolution.
(Credit: Vostok ice core data/J.R. Petit et al.; NOAA Mauna Loa CO2 record.)

The Keeling Curve, January 27, 2015, Scripps Institution of Oceanography, UC San Diego
| Claim | Click here for more information | Synopsis | If refuted, by: |
| CO2 levels in the atmosphere are rising | Carbon-dioxide concentrations hit their highest level in 4m years, | Mauna Loa University, as reported by the Economist, May 11th 2013 | |
| Nasa, Graph of Atmosphereic carbon, | The Earth's climate has changed throughout history. Just in the last 650,000 years there have been seven cycles of glacial advance and retreat, with the abrupt end of the last ice age about 7,000 years ago marking the beginning of the modern climate era - and of human civilization. Most of these climate changes are attributed to very small variations in Earth's orbit that change the amount of solar energy our planet receives. The current warming trend is of particular significance because most of it is very likely human-induced and proceeding at a rate that is unprecedented in the past 1,300 years.1 |
-->