Translate this page to any language by choosing a language in the box below.
Yes, the climate is changing, and we need to take reasonable actions to reduce humanity's impact on the planet. But there are plenty of folks who are eager to predict doom and gloom... in order to get wealth, power or simply attention.
 The
EPA has made predictions (a.k.a, projections) about what will happen if climate change continues as they expect. We love a prediction, who
hasn't read their horoscope or had a psychic reading at least once? But, predicting doom and gloom is a challenging subject, fraught
with , well, doom and failure.
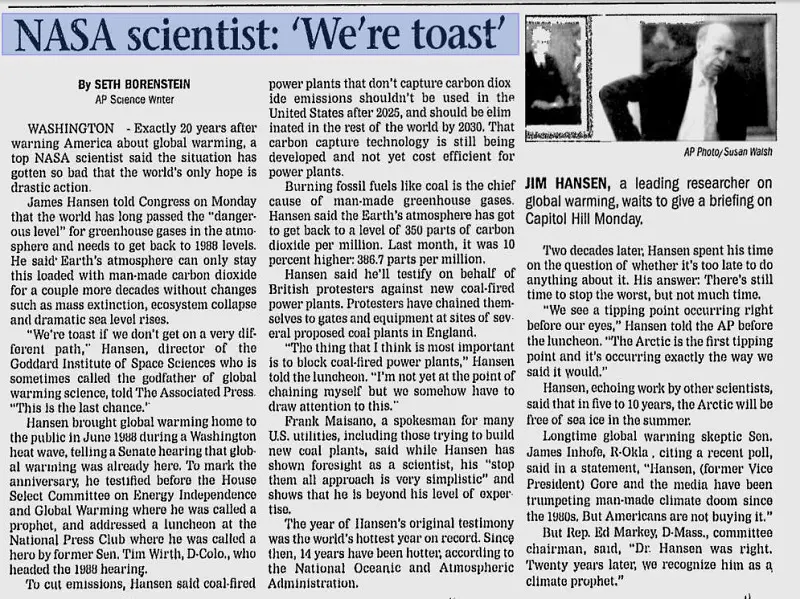
Recall these recent and failed predictions (and don't take our world for them, follow the links to sources and in some cases, see these goofballs making their insane predictions):

So with this body of historical evidence, we at EHSO are going to openly mock these crazy predictions for their sheer hubris and idiocy in predicting "The End" yet again.
Don't you guys ever learn?
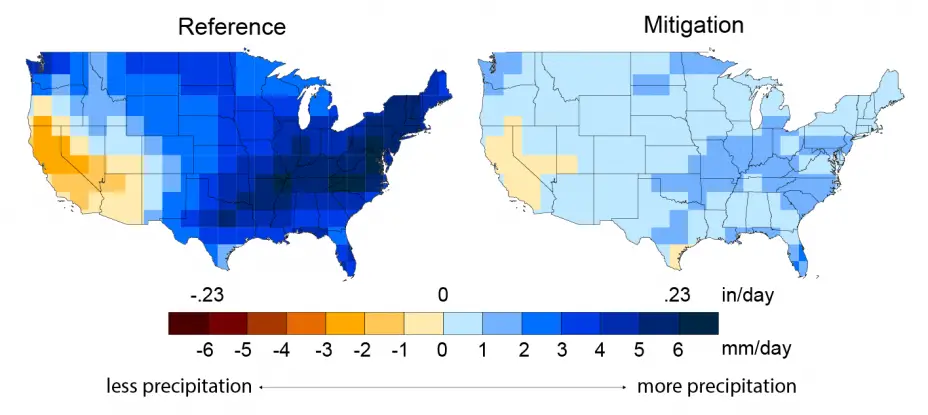
The EPA's predictions are more rational, not as immediate, but still dire.
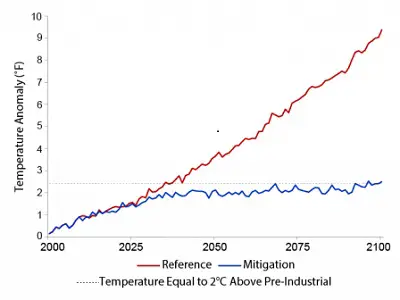
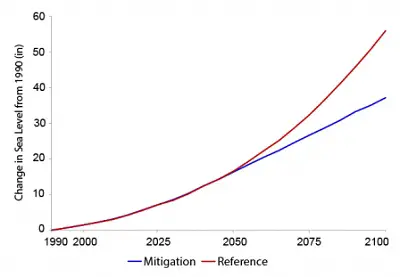
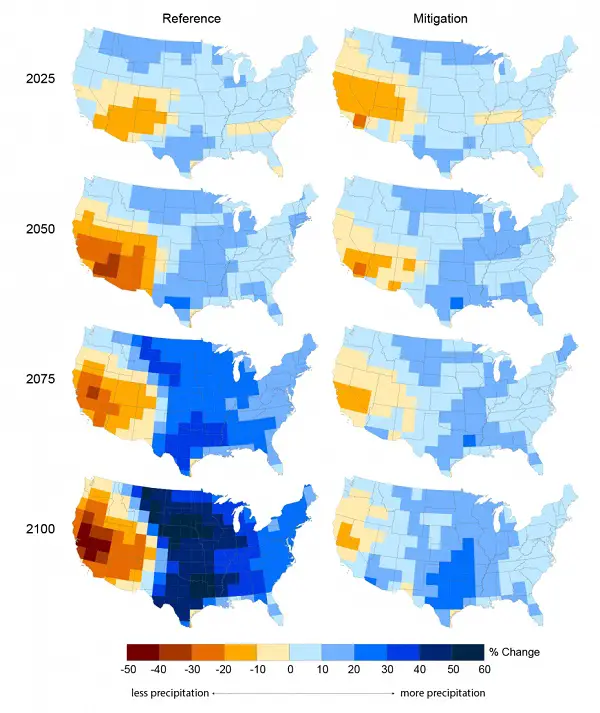
The graphs have two lines; Reference and Mitigation. The red reference line is if we do nothing' the blue, if we take their recommended mitigation efforts.
And though they are based in science, they are still "best guesses" using relatively miniscule data and simple algorithms (compared to the size and complexity of the earth itself) to attempt to approximate the immense and complex interactions that occur in nature.
Even using the most sophisticated computer models available, just look at the accuracy of weather forecasts. So, take these predictions with a grain of salt the size of the moon...
 mperature Projections
- Global mean temperature under the CIRA Reference scenario is projected to increase by over 9�F by 2100 (Figure 1). This estimated increase is
consistent with the USGCRP Third National Climate Assessment, which projects a range of 5-11�F by 2100.14,15 To help illustrate the magnitude of
such a change in global mean temperature, the last ice age, which covered the northern contiguous U.S. with ice sheets, was approximately 9�F
cooler than today. While some areas will experience greater increases than others, Figure 1 presents the average change that is projected to
occur across the globe under the Reference and Mitigation scenarios. As shown, temperatures in the Mitigation scenario eventually stabilize,
though due to the inertia of the climate system, stabilization is not reached until several decades after the peak in radiative forcing. The
Reference scenario continues to warm, reaching a temperature increase of almost five times that of the Mitigation scenario by the end of the
century. This demonstrates that significant GHG mitigation efforts can stabilize temperatures and avoid an additional 7�F of warming this
century, but due to climate system inertia, benefits may not be apparent for several decades.
 Sea Level Rise Projections
- Global mean sea levels are projected to rise about 56 inches by 2100 under the Reference and about 37 inches under the Mitigation scenario
Ways to save money AND help the environment:
Eat healthier AND save money: Instant Pot Duo Crisp 11-in-1 Air Fryer and Electric Pressure Cooker Combo with Multicooker Lids that Fries, Steams, Slow Cooks, Sautés, Dehydrates
Save water AND money with this showerhead adapter, it lets the water flow until the water is hot, then shuts off water flow until you restart it, ShowerStart TSV Hot Water Standby Adapter
Protect your health with these:
Mattress Dust mite-Bedbug protector, 100% Waterproof, Hypoallergenic, Zippered
Handheld Allergen Vacuum Cleaner with UV Sanitizing and Heating for Allergies and Pet, Kills Mite, Virus, Molds, True HEPA with Powerful Suction removes Hair, Dander, Pollen, Dust,
Immune Support Supplement with Quercetin, Vitamin C, Zinc, Vitamin D3
GermGuardian Air Purifier with UV-C Light and HEPA 13 Filter, Removes 99.97% of Pollutants
5 Stage Air Purifier, Features Ultraviolet Light (UVC), H13 True Hepa, Carbon, PCO, Smart Wifi, Auto Mode, Quiet, Removes 99.97% of Particles, Smoke, Mold, Pet Dander, Dust, Odors
Interesting Reads:
THE PREPPER'S CANNING & PRESERVING BIBLE: [13 in 1] Your Path to Food Self-Sufficiency. Canning, Dehydrating, Fermenting, Pickling & More, Plus The Food Preservation Calendar for a Sustainable Pantry
The Backyard Homestead: Produce all the food you need on just a quarter acre! Paperback
The Citizens' Guide to Geologic Hazards: A Guide to Understanding Geologic Hazards Including Asbestos, Radon, Swelling Soils, Earthquakes, Volcanoes
The Uninhabitable Earth: Life After Warming
Book: The Sixth Extinction: An Unnatural History Paperback