
|
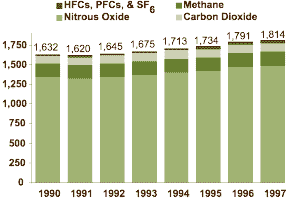
Figure ES-1
|
|
|
Figure ES-2
Annual Percent Change in U.S. GHG Emissions 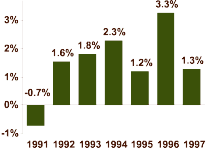
|
Figure ES-3
Absolute Change in U.S. GHG Emissions Since 1990 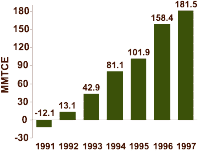
|
|
Gas - Source |
1990 |
1991 |
1992 |
1993 |
1994 |
1995 |
1996 |
1997 |
|
CO 2 |
1,344.3 |
1,329.8 |
1,349.6 |
1,379.2 |
1,403.5 |
1,419.2 |
1,469.3 |
1,487.9 |
|
|
1,327.2 |
1,312.6 |
1,332.4 |
1,360.6 |
1,383.9 |
1,397.8 |
1,447.7 |
1,466.0 |
|
|
2.3 |
2.6 |
2.6 |
3.5 |
3.6 |
4.5 |
4.3 |
4.2 |
|
|
8.9 |
8.7 |
8.8 |
9.3 |
9.6 |
9.9 |
9.9 |
10.2 |
|
|
3.3 |
3.2 |
3.3 |
3.4 |
3.5 |
3.7 |
3.8 |
3.9 |
|
|
1.4 |
1.3 |
1.2 |
1.1 |
1.5 |
1.9 |
2.0 |
2.1 |
|
|
1.1 |
1.1 |
1.1 |
1.1 |
1.1 |
1.2 |
1.2 |
1.2 |
|
|
0.2 |
0.2 |
0.2 |
0.2 |
0.2 |
0.3 |
0.3 |
0.3 |
|
|
(311.5) |
(311.5) |
(311.5) |
(208.6) |
(208.6) |
(208.6) |
(208.6) |
(208.6) |
|
|
27.1 |
27.8 |
29.0 |
29.9 |
27.4 |
25.4 |
25.4 |
26.6 |
|
CH 4 |
169.9 |
171.0 |
172.5 |
172.0 |
175.5 |
178.6 |
178.3 |
179.6 |
|
|
2.3 |
2.4 |
2.4 |
2.4 |
2.4 |
2.5 |
2.5 |
2.2 |
|
|
1.4 |
1.4 |
1.4 |
1.4 |
1.4 |
1.4 |
1.4 |
1.4 |
|
|
24.0 |
22.8 |
22.0 |
19.2 |
19.4 |
20.3 |
18.9 |
18.8 |
|
|
32.9 |
33.3 |
33.9 |
34.1 |
33.5 |
33.2 |
33.7 |
33.5 |
|
|
1.6 |
1.6 |
1.6 |
1.6 |
1.6 |
1.6 |
1.5 |
1.6 |
|
|
0.3 |
0.3 |
0.3 |
0.4 |
0.4 |
0.4 |
0.4 |
0.4 |
|
|
+ |
+ |
+ |
+ |
+ |
+ |
+ |
+ |
|
|
32.7 |
32.8 |
33.2 |
33.6 |
34.5 |
34.9 |
34.5 |
34.1 |
|
|
14.9 |
15.4 |
16.0 |
16.1 |
16.7 |
16.9 |
16.6 |
17.0 |
|
|
2.5 |
2.5 |
2.8 |
2.5 |
3.0 |
2.8 |
2.5 |
2.7 |
|
|
0.2 |
0.2 |
0.2 |
0.2 |
0.2 |
0.2 |
0.2 |
0.2 |
|
|
56.2 |
57.6 |
57.8 |
59.7 |
61.6 |
63.6 |
65.1 |
66.7 |
|
|
0.9 |
0.9 |
0.9 |
0.9 |
0.9 |
0.9 |
0.9 |
0.9 |
|
|
+ |
+ |
+ |
+ |
+ |
+ |
+ |
+ |
|
N 2 O |
95.7 |
97.6 |
100.1 |
100.4 |
108.3 |
105.4 |
108.2 |
109.0 |
|
|
3.8 |
3.8 |
3.9 |
3.9 |
4.0 |
4.0 |
4.1 |
4.1 |
|
|
13.6 |
14.2 |
15.2 |
15.9 |
16.7 |
17.0 |
17.4 |
17.5 |
|
|
4.7 |
4.9 |
4.6 |
4.9 |
5.2 |
5.2 |
5.4 |
3.9 |
|
|
3.3 |
3.3 |
3.4 |
3.5 |
3.7 |
3.7 |
3.9 |
3.8 |
|
|
2.6 |
2.8 |
2.8 |
2.9 |
2.9 |
2.9 |
3.0 |
3.0 |
|
|
65.3 |
66.2 |
68.0 |
67.0 |
73.4 |
70.2 |
72.0 |
74.1 |
|
|
0.1 |
0.1 |
0.1 |
0.1 |
0.1 |
0.1 |
0.1 |
0.1 |
|
|
2.1 |
2.1 |
2.2 |
2.2 |
2.2 |
2.3 |
2.3 |
2.3 |
|
|
0.1 |
0.1 |
0.1 |
0.1 |
0.1 |
0.1 |
0.1 |
0.1 |
|
|
0.2 |
0.2 |
0.2 |
0.3 |
0.2 |
0.2 |
0.2 |
0.2 |
|
HFCs, PFCs, and SF 6 |
22.2 |
21.6 |
23.0 |
23.4 |
25.9 |
30.8 |
34.7 |
37.1 |
|
|
0.3 |
0.2 |
0.4 |
1.4 |
4.0 |
9.5 |
11.9 |
14.7 |
|
|
4.9 |
4.7 |
4.1 |
3.5 |
2.8 |
2.7 |
2.9 |
2.9 |
|
|
9.5 |
8.4 |
9.5 |
8.7 |
8.6 |
7.4 |
8.5 |
8.2 |
|
|
0.2 |
0.4 |
0.6 |
0.8 |
1.0 |
1.2 |
1.4 |
1.3 |
|
|
5.6 |
5.9 |
6.2 |
6.4 |
6.7 |
7.0 |
7.0 |
7.0 |
|
|
1.7 |
2.0 |
2.2 |
2.5 |
2.7 |
3.0 |
3.0 |
3.0 |
|
Total Emissions |
1,632.1 |
1,620.0 |
1,645.2 |
1,675.0 |
1,713.2 |
1,733.9 |
1,790.5 |
1,813.6 |
|
Net Emission
|
1,320.6 |
1,308.5 |
1,333.7 |
1,466.5 |
1,504.7 |
1,525.4 |
1,582.0 |
1,605.0 |
Figure ES-4: 1997 Greenhouse Gas Emissions by Gas
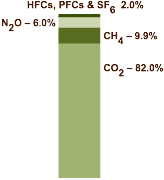
![]() Figure ES-4 illustrates the relative contribution of the direct greenhouse gases to total U.S. emissions in 1997. The primary greenhouse gas emitted by human activities was CO
2
. The largest source of CO
2
and of overall greenhouse gas emissions in the United States was fossil fuel combustion. Methane emissions resulted primarily from decomposition of wastes in landfills, manure and enteric fermentation associated with domestic livestock, natural gas systems, and coal mining. Emissions of N
2
O were dominated by agricultural soil management and mobile source fossil fuel combustion. The substitution of ozone depleting substances and emissions of HFC-23 during the production of HCFC-22 were the primary contributors to aggregate HFC emissions. PFC emissions came mainly from primary aluminum production, while electrical transmission and distribution systems emitted the majority of SF
6
.
Figure ES-4 illustrates the relative contribution of the direct greenhouse gases to total U.S. emissions in 1997. The primary greenhouse gas emitted by human activities was CO
2
. The largest source of CO
2
and of overall greenhouse gas emissions in the United States was fossil fuel combustion. Methane emissions resulted primarily from decomposition of wastes in landfills, manure and enteric fermentation associated with domestic livestock, natural gas systems, and coal mining. Emissions of N
2
O were dominated by agricultural soil management and mobile source fossil fuel combustion. The substitution of ozone depleting substances and emissions of HFC-23 during the production of HCFC-22 were the primary contributors to aggregate HFC emissions. PFC emissions came mainly from primary aluminum production, while electrical transmission and distribution systems emitted the majority of SF
6
.
![]() As the largest source of U.S. GHG emissions, CO
2
from fossil fuel combustion accounted for 81 percent of emissions in 1997 when each gas is weighted by its
Global Warming Potential
. Emissions from this source grew by 11 percent (138.8 MMTCE) from 1990 to 1997 and were responsible for over three-quarters of the increase in national emissions during this period. The annual increase in CO
2
emissions from this source was 1.3 percent in 1997, down from the previous year when emissions increased by 3.6 percent.
As the largest source of U.S. GHG emissions, CO
2
from fossil fuel combustion accounted for 81 percent of emissions in 1997 when each gas is weighted by its
Global Warming Potential
. Emissions from this source grew by 11 percent (138.8 MMTCE) from 1990 to 1997 and were responsible for over three-quarters of the increase in national emissions during this period. The annual increase in CO
2
emissions from this source was 1.3 percent in 1997, down from the previous year when emissions increased by 3.6 percent.
![]() The dramatic increase in fossil fuel combustion-related CO
2
emissions in 1996 was primarily a function of two factors: 1) fuel switching by electric utilities from natural gas to more carbon intensive coal as gas prices rose sharply due to weather conditions, which drove up residential consumption of natural gas for heating; and 2) higher petroleum consumption for transportation. In 1997, by comparison, electric utility natural gas consumption rose to regain much of the previous year's decline as the supply available rose due to lower residential consumption. Despite this increase in natural gas consumption by utilities and relatively stagnant U.S. electricity consumption, coal consumption rose in 1997 to offset the temporary shut-down of several nuclear power plants. Petroleum consumption for transportation activities in 1997 also grew by less than one percent, compared to over three percent the previous year (see Table ES-2). The annual increase in CO
2
emissions from petroleum in 1997 is based on motor gasoline sales data from the U.S. Energy Information Administration; it is expected to be revised upward with the publication of future energy statistics.
The dramatic increase in fossil fuel combustion-related CO
2
emissions in 1996 was primarily a function of two factors: 1) fuel switching by electric utilities from natural gas to more carbon intensive coal as gas prices rose sharply due to weather conditions, which drove up residential consumption of natural gas for heating; and 2) higher petroleum consumption for transportation. In 1997, by comparison, electric utility natural gas consumption rose to regain much of the previous year's decline as the supply available rose due to lower residential consumption. Despite this increase in natural gas consumption by utilities and relatively stagnant U.S. electricity consumption, coal consumption rose in 1997 to offset the temporary shut-down of several nuclear power plants. Petroleum consumption for transportation activities in 1997 also grew by less than one percent, compared to over three percent the previous year (see Table ES-2). The annual increase in CO
2
emissions from petroleum in 1997 is based on motor gasoline sales data from the U.S. Energy Information Administration; it is expected to be revised upward with the publication of future energy statistics.
![]()
| Sector | Fuel Type | 19951996 | 19961997 |
| Electric Utility | Coal | 5.7% | 2.9% |
| Electric Utility | Natural Gas | -14.6% | 8.7% |
| Residential | Natural Gas | 8.1% | -4.4% |
| Transportation* | Petroleum | 3.4% | 0.3% |
| * Excludes emissions from International Bunker Fuels. | |||
|
Aggregate HFC and PFC emissions resulting from the substitution of ozone depleting substances (e.g., CFCs) increased dramatically (by 14.4 MMTCE). This increase was partly offset, however, by reductions in PFC emissions from aluminum production (41 percent) and HFC emissions from HCFC-22 production (14 percent), both as a result of voluntary industry emission reduction efforts and, in the former case, from falling domestic aluminum production.
|
|
|
Combined N2O and CH4 emissions from mobile source fossil fuel combustion rose by 3.9 MMTCE (26 percent), primarily due to increased rates of N2O generation in highway vehicles.
|
|
|
Methane emissions from the decomposition of waste in municipal and industrial landfills rose by 10.5 MMTCE (19 percent) as the amount of organic matter in landfills steadily accumulated.
|
|
|
Emissions from coal mining dropped by 5.2 MMTCE (21 percent) as the use of methane from degasification systems increased significantly.
|
|
|
Nitrous oxide emissions from agricultural soil management increased by 8.8 MMTCE (13 percent) as fertilizer consumption and cultivation of nitrogen fixing crops rose.
|
|
|
An additional domestic adipic acid plant installed emission control systems in 1997; this was estimated to have resulted in a 1.4 MMTCE (27 percent) decline in emissions from 1996 to 1997 despite an increase in production.
|
Box ES-1: Recent Trends in Various U.S. Greenhouse Gas Emissions-Related Data
|
|
Table ES-3: Recent Trends in Various U.S. Data (Index 1990 = 100)
|
Variable |
1990 |
1991 |
1992 |
1993 |
1994 |
1995 |
1996 |
1997 |
Growth Rate (g) |
|
GHG Emissions (a) |
100 |
99 |
101 |
103 |
105 |
106 |
110 |
111 |
1.5% |
| Energy Consumption (b) |
100 |
100 |
101 |
104 |
106 |
108 |
112 |
112 |
1.6% |
| Fossil Fuel Consumption (c) |
100 |
99 |
101 |
104 |
106 |
107 |
110 |
112 |
1.6% |
| Electricity Consumption (c) |
100 |
102 |
102 |
105 |
108 |
111 |
114 |
115 |
2.0% |
| GDP (d) |
100 |
99 |
102 |
104 |
108 |
110 |
114 |
118 |
2.5% |
| Population (e) |
100 |
101 |
102 |
103 |
104 |
105 |
106 |
107 |
1.0% |
| Atmospheric CO 2 Concentration (f) |
100 |
100 |
101 |
101 |
101 |
102 |
102 |
103 |
0.4% |
|
(a) GWP weighted values
(b) Energy content weighted values. Source: DOE/EIA (c) Source: DOE/EIA (d) Gross Domestic Product in chained 1992 dollars (BEA 1998) (e) (U.S. Census Bureau 1998) (f) Mauna Loa Observatory, Hawaii (Keeling and Whorf 1998) (g) Average annual growth rate |
|||||||||
|
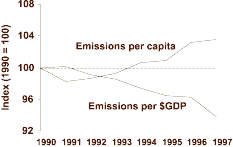
Figure ES-5
U.S. Greenhouse Gas Emissions Per Capita and Per Dollar of Gross Domestic Product |
|
Box ES-2: Greenhouse Gas Emissions from Transportation Activities
|
|
|
Gas - Vehicle Type |
1990 |
1991 |
1992 |
1993 |
1994 |
1995 |
1996 |
1997 |
|
CO 2 |
405.0 |
396.7 |
402.4 |
406.8 |
422.1 |
430.7 |
445.3 |
446.5 |
|
|
169.3 |
167.8 |
172.0 |
173.5 |
172.5 |
175.6 |
160.8 |
162.6 |
|
|
77.5 |
77.2 |
77.2 |
80.5 |
87.2 |
89.2 |
109.9 |
111.1 |
|
|
57.3 |
55.1 |
56.7 |
59.9 |
62.7 |
64.2 |
68.3 |
69.5 |
|
|
2.7 |
2.9 |
2.9 |
3.1 |
3.3 |
3.5 |
3.0 |
3.0 |
|
|
50.5 |
48.4 |
47.4 |
47.6 |
49.6 |
48.3 |
50.5 |
50.1 |
|
|
16.4 |
15.9 |
16.4 |
11.7 |
13.9 |
16.8 |
18.5 |
15.4 |
|
|
7.5 |
6.9 |
7.4 |
6.8 |
8.0 |
8.1 |
8.8 |
9.0 |
|
|
23.8 |
22.5 |
22.4 |
23.8 |
24.9 |
24.9 |
25.5 |
25.8 |
|
|
27.1 |
27.8 |
29.0 |
29.9 |
27.4 |
25.4 |
25.4 |
26.6 |
|
CH 4 |
1.4 |
1.4 |
1.4 |
1.4 |
1.4 |
1.4 |
1.4 |
1.4 |
|
|
0.8 |
0.7 |
0.7 |
0.7 |
0.7 |
0.7 |
0.6 |
0.6 |
|
|
0.4 |
0.4 |
0.4 |
0.4 |
0.4 |
0.4 |
0.5 |
0.5 |
|
|
0.1 |
0.1 |
0.1 |
0.2 |
0.2 |
0.2 |
0.2 |
0.2 |
|
|
+ |
+ |
+ |
+ |
+ |
+ |
+ |
+ |
|
|
+ |
+ |
+ |
+ |
+ |
+ |
+ |
+ |
|
|
+ |
+ |
+ |
+ |
+ |
+ |
+ |
+ |
|
|
0.1 |
0.1 |
0.1 |
0.1 |
0.1 |
0.1 |
0.1 |
0.1 |
|
|
+ |
+ |
+ |
+ |
+ |
+ |
+ |
+ |
|
N 2 O |
13.6 |
14.2 |
15.2 |
15.9 |
16.7 |
17.0 |
17.4 |
17.5 |
|
|
8.7 |
9.1 |
9.7 |
10.1 |
10.0 |
10.1 |
8.9 |
9.1 |
|
|
3.4 |
3.7 |
3.9 |
4.2 |
5.1 |
5.2 |
6.8 |
6.8 |
|
|
0.7 |
0.7 |
0.7 |
0.7 |
0.8 |
0.8 |
0.9 |
0.9 |
|
|
0.5 |
0.5 |
0.5 |
0.5 |
0.5 |
0.5 |
0.5 |
0.5 |
|
|
0.1 |
0.1 |
0.1 |
0.1 |
0.1 |
0.1 |
0.1 |
0.1 |
|
|
0.1 |
0.1 |
0.1 |
0.1 |
0.1 |
0.1 |
0.1 |
0.1 |
|
|
0.2 |
0.2 |
0.2 |
0.2 |
0.2 |
0.2 |
0.2 |
0.2 |
|
HFCs |
+ |
+ |
0.2 |
0.7 |
1.3 |
2.5 |
3.6 |
4.5 |
|
|
+ |
+ |
0.2 |
0.7 |
1.3 |
2.5 |
3.6 |
4.5 |
|
Total |
420.0 |
412.3 |
419.1 |
424.8 |
441.5 |
451.6 |
467.7 |
469.9 |
|
|
|
Gas - Fuel Type or Source |
1990 |
1991 |
1992 |
1993 |
1994 |
1995 |
1996 |
1997 |
|
CO 2 |
476.8 |
473.4 |
472.5 |
490.7 |
494.8 |
494.1 |
513.2 |
532.3 |
|
|
409.0 |
407.2 |
411.8 |
428.7 |
430.2 |
433.0 |
457.5 |
470.9 |
|
|
41.2 |
41.1 |
40.7 |
39.5 |
44.0 |
47.2 |
40.3 |
43.8 |
|
|
26.6 |
25.1 |
19.9 |
22.5 |
20.6 |
14.0 |
15.4 |
17.6 |
|
|
0.1 |
0.1 |
0.1 |
0.1 |
+ |
+ |
+ |
+ |
|
CH 4 |
0.1 |
0.1 |
0.1 |
0.1 |
0.1 |
0.1 |
0.1 |
0.1 |
|
|
0.1 |
0.1 |
0.1 |
0.1 |
0.1 |
0.1 |
0.1 |
0.1 |
|
N 2 O |
2.0 |
2.0 |
2.0 |
2.1 |
2.1 |
2.1 |
2.2 |
2.3 |
|
|
2.0 |
2.0 |
2.0 |
2.1 |
2.1 |
2.1 |
2.2 |
2.3 |
|
SF 6 |
5.6 |
5.9 |
6.2 |
6.4 |
6.7 |
7.0 |
7.0 |
7.0 |
|
|
5.6 |
5.9 |
6.2 |
6.4 |
6.7 |
7.0 |
7.0 |
7.0 |
|
Total |
484.6 |
481.4 |
480.8 |
499.3 |
503.7 |
503.3 |
522.5 |
541.7 |
Ways to save money AND help the environment:
Eat healthier AND save money: Instant Pot Duo Crisp 11-in-1 Air Fryer and Electric Pressure Cooker Combo with Multicooker Lids that Fries, Steams, Slow Cooks, Sautés, Dehydrates
Save water AND money with this showerhead adapter, it lets the water flow until the water is hot, then shuts off water flow until you restart it, ShowerStart TSV Hot Water Standby Adapter
Protect your health with these:
Mattress Dust mite-Bedbug protector, 100% Waterproof, Hypoallergenic, Zippered
Handheld Allergen Vacuum Cleaner with UV Sanitizing and Heating for Allergies and Pet, Kills Mite, Virus, Molds, True HEPA with Powerful Suction removes Hair, Dander, Pollen, Dust,
Immune Support Supplement with Quercetin, Vitamin C, Zinc, Vitamin D3
GermGuardian Air Purifier with UV-C Light and HEPA 13 Filter, Removes 99.97% of Pollutants
5 Stage Air Purifier, Features Ultraviolet Light (UVC), H13 True Hepa, Carbon, PCO, Smart Wifi, Auto Mode, Quiet, Removes 99.97% of Particles, Smoke, Mold, Pet Dander, Dust, Odors
Interesting Reads:
THE PREPPER'S CANNING & PRESERVING BIBLE: [13 in 1] Your Path to Food Self-Sufficiency. Canning, Dehydrating, Fermenting, Pickling & More, Plus The Food Preservation Calendar for a Sustainable Pantry
The Backyard Homestead: Produce all the food you need on just a quarter acre! Paperback
The Citizens' Guide to Geologic Hazards: A Guide to Understanding Geologic Hazards Including Asbestos, Radon, Swelling Soils, Earthquakes, Volcanoes
The Uninhabitable Earth: Life After Warming
Book: The Sixth Extinction: An Unnatural History Paperback